Finding Lane Lines on the Road (Code)
The goal of this project is to identify lane lines on the road. At first the pipeline is developed on a series of individual images, and later the result is applied to a video stream.
The tools used are (in the following order):
- Grayscaling
- Gaussian smoothing
- Color selection
- Region of interest selection
- Canny Edge Detection
- Hough Tranform line detection
The project is developed using Python and OpenCv. You can download the full code from GitHub.
Pipeline
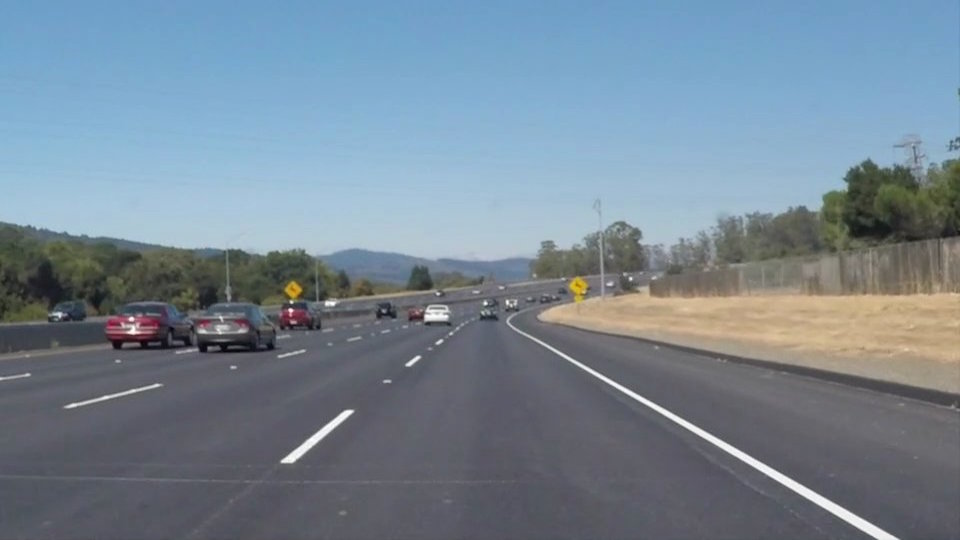
I started by reading in the test image
#reading in an image
image = mpimg.imread('test_images/solidWhiteRight.jpg')
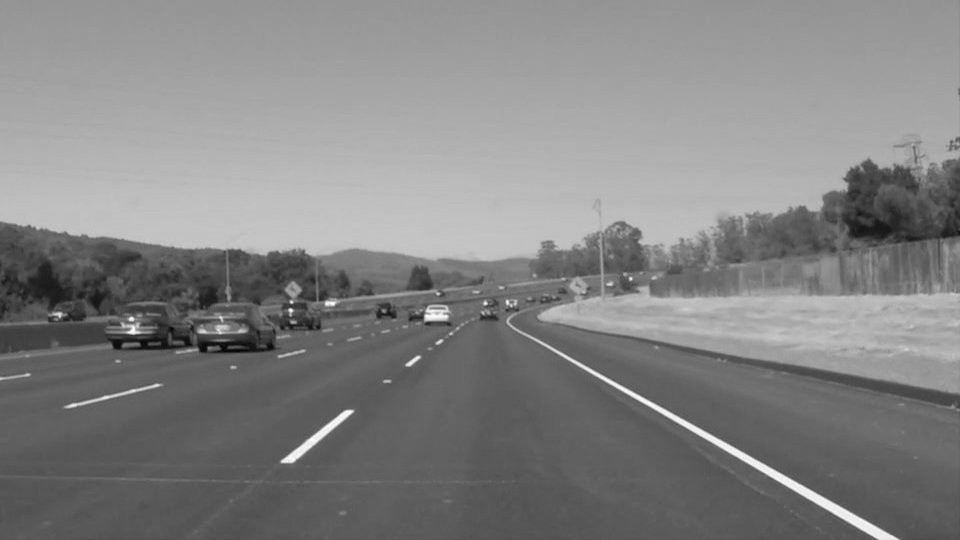
Later, I converted the image to grayscale using the helper function
def grayscale(img):
    """Applies the Grayscale transform
    This will return an image with only one color channel
    but NOTE: to see the returned image as grayscale
    (assuming your grayscaled image is called 'gray')
    you should call plt.imshow(gray, cmap='gray')"""
    return cv2.cvtColor(img, cv2.COLOR_RGB2GRAY)
    # Or use BGR2GRAY if you read an image with cv2.imread()
    # return cv2.cvtColor(img, cv2.COLOR_BGR2GRAY)

# Read in a grayscale the image
gray_img = grayscale(img)
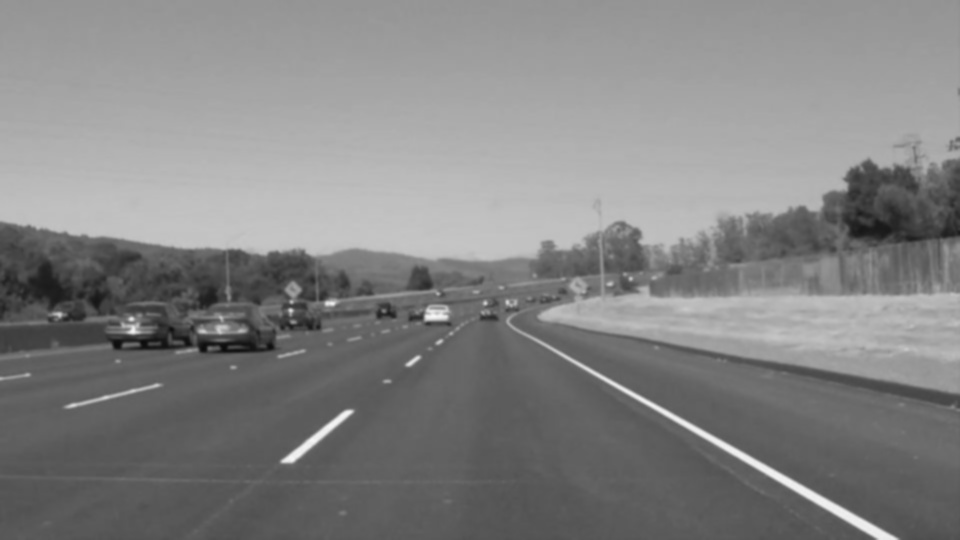
Then I applied the Gaussian Smoothing filter using a kernel size of 5 to get rid of noise
def gaussian_blur(img, kernel_size):
    """Applies a Gaussian Noise kernel"""
    return cv2.GaussianBlur(img, (kernel_size, kernel_size), 0)

# Apply guassian filter to smooth noise
kernel_size = 5
blur_gray = gaussian_blur(gray_img, kernel_size)
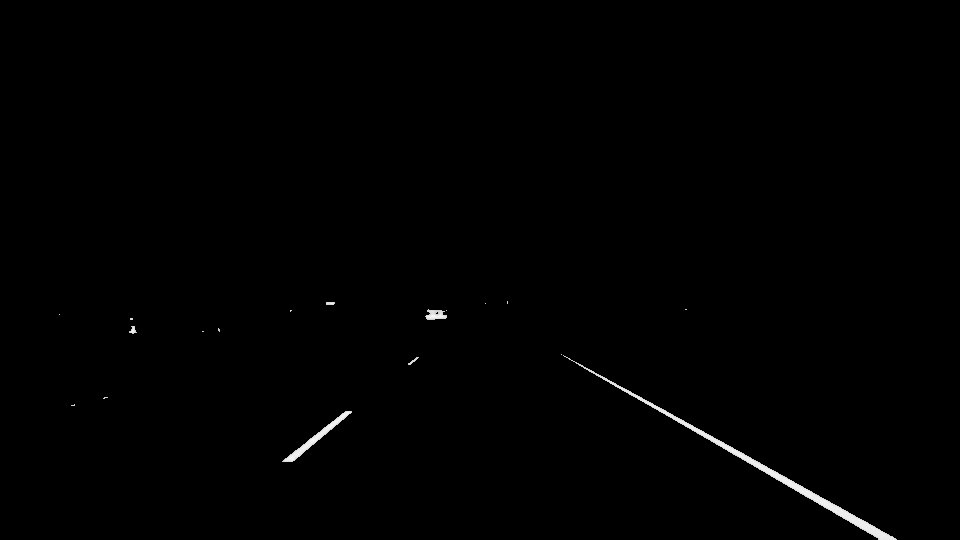
After that, I used Color Selection to highlight the lane lines only
def apply_threshold(image, rgb_threshold):
    highlighted_img = np.copy(image)
    if len(image.shape) > 2:
        color_thresholds = ((image[:,:,0] < rgb_threshold[0]) | (image[:,:,1] < rgb_threshold[1]) | (image[:,:,2] < rgb_threshold[2]))
        highlighted_img[color_thresholds] = [0,0,0]
    else:
        color_thresholds = ((image[:,:] < rgb_threshold[0]))
        highlighted_img[color_thresholds] = 0
    return highlighted_img

pixel_threshold = 200
rgb_threshold = [pixel_threshold]
highlighted_img = apply_threshold(blur_gray, rgb_threshold)
The Canny Edge Operator with a low threshold of 50 and a high threshold of 150 helped me detect edges
def canny(img, low_threshold, high_threshold):
    """Applies the Canny transform"""
    return cv2.Canny(img, low_threshold, high_threshold)

# Apply Canny operator to obtain edges
low_threshold = 50
high_threshold = 150
edges = canny(highlighted_img, low_threshold, high_threshold)
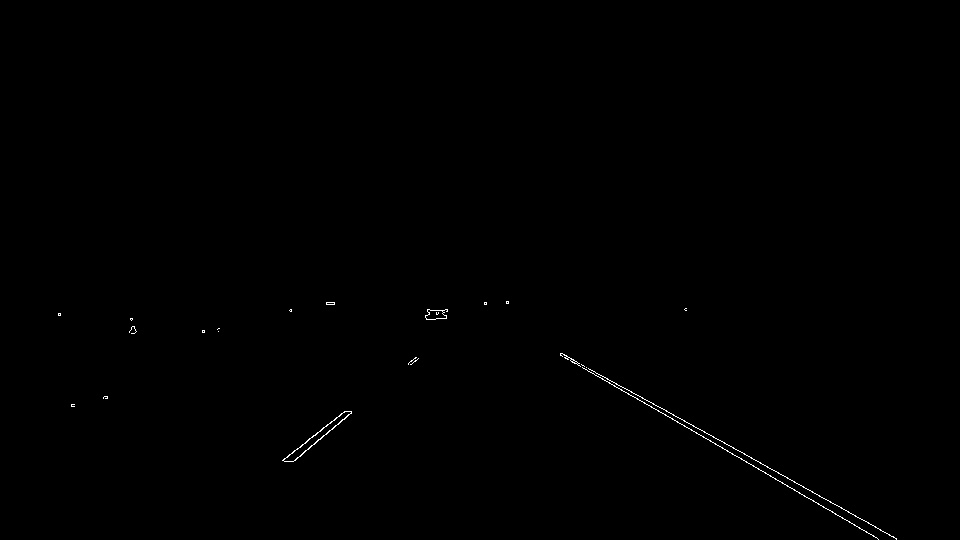
And through the use of a Trapezoidal Mask I isolated only the lane lines
def region_of_interest(img, vertices):
    """
    Applies an image mask.

    Only keeps the region of the image defined by the polygon
    formed from `vertices`. The rest of the image is set to black.
    `vertices` should be a numpy array of integer points.
    """
    #defining a blank mask to start with
    mask = np.zeros_like(img)

    #defining a 3 channel or 1 channel color to fill the mask with depending on the input image
    if len(img.shape) > 2:
        channel_count = img.shape[2]  # i.e. 3 or 4 depending on your image
        ignore_mask_color = (255,) * channel_count
    else:
        ignore_mask_color = 255

    #filling pixels inside the polygon defined by "vertices" with the fill color
    cv2.fillPoly(mask, vertices, ignore_mask_color)

    #returning the image only where mask pixels are nonzero
    masked_image = cv2.bitwise_and(img, mask)
    return masked_image

# Create mask
imshape = img.shape
vertices = np.array([[(0,imshape[0]),(450, 320), (490, 320), (imshape[1],imshape[0])]], dtype=np.int32)
#vertices = np.array([[(50,imshape[0]),(470, 320), (imshape[1] - 50,imshape[0])]], dtype=np.int32)
masked_img = region_of_interest(edges, vertices)
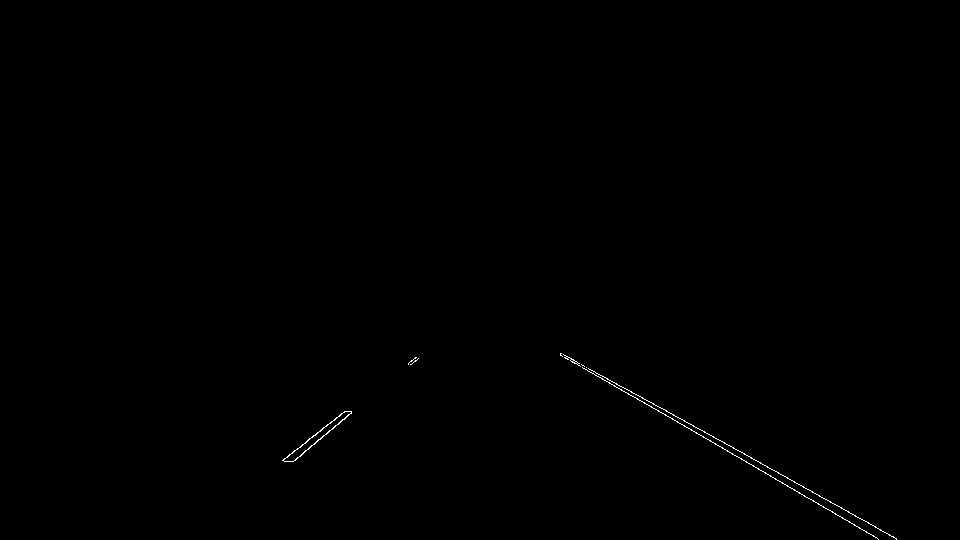
Following, I used a Hough Transform to detect the lines with parameters:
- rho = 1
- theta = pi/180
- threshold = 30 minimum number of votes (intersections in Hough grid cell)
- min_line_len = 40 minimum number of pixels making up a line
- max_line_gap = 100 maximum gap in pixels between connectable line segments
def hough_lines(img, ytop, rho, theta, threshold, min_line_len, max_line_gap):
    """
    `img` should be the output of a Canny transform.

    Returns an image with hough lines drawn.
    """
    lines = cv2.HoughLinesP(img, rho, theta, threshold, np.array([]), minLineLength=min_line_len, maxLineGap=max_line_gap)
    line_img = np.zeros((img.shape[0], img.shape[1], 3), dtype=np.uint8)
    draw_lines(line_img, lines, ytop)
    return line_img

# Use Hough Transform to detect lines in the mask image
line_image = hough_lines(masked_img, 320, rho, theta, threshold, min_line_len, max_line_gap)
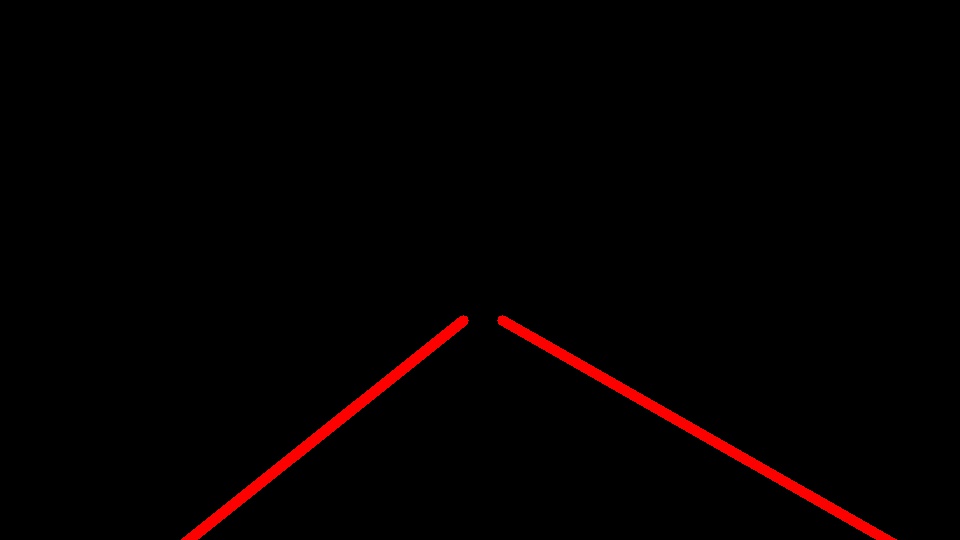
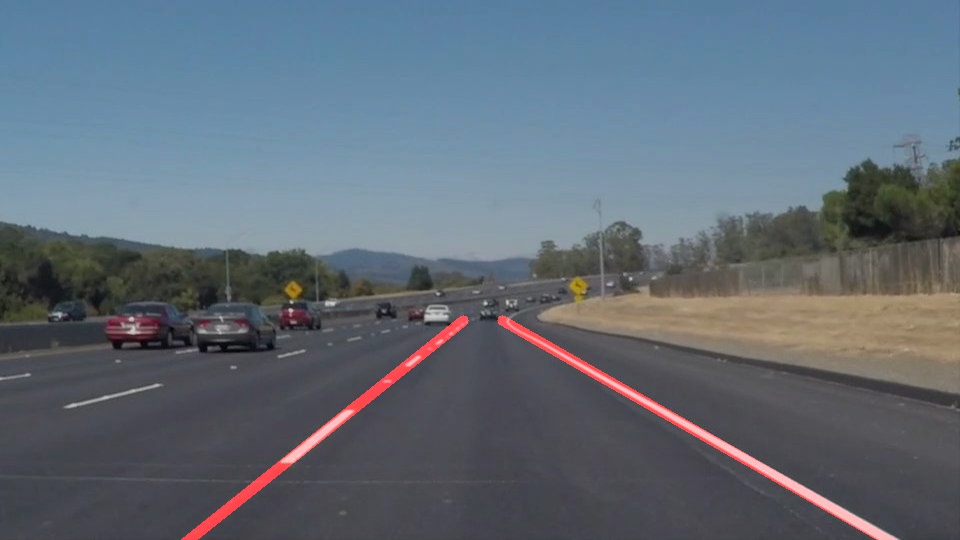
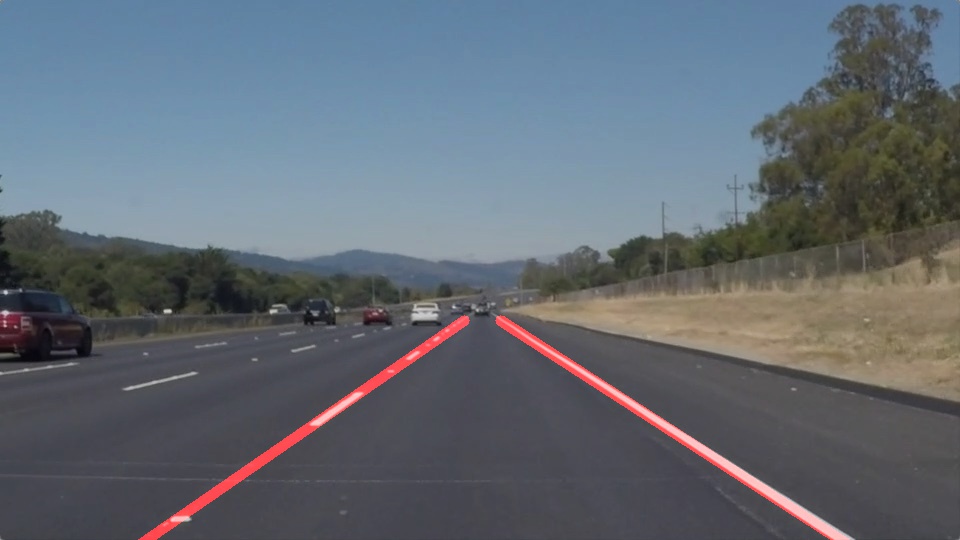
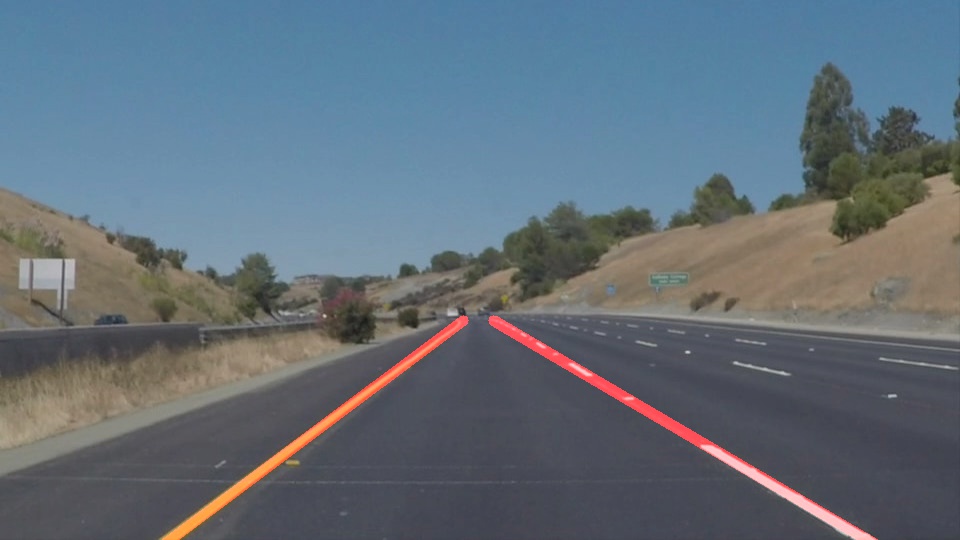
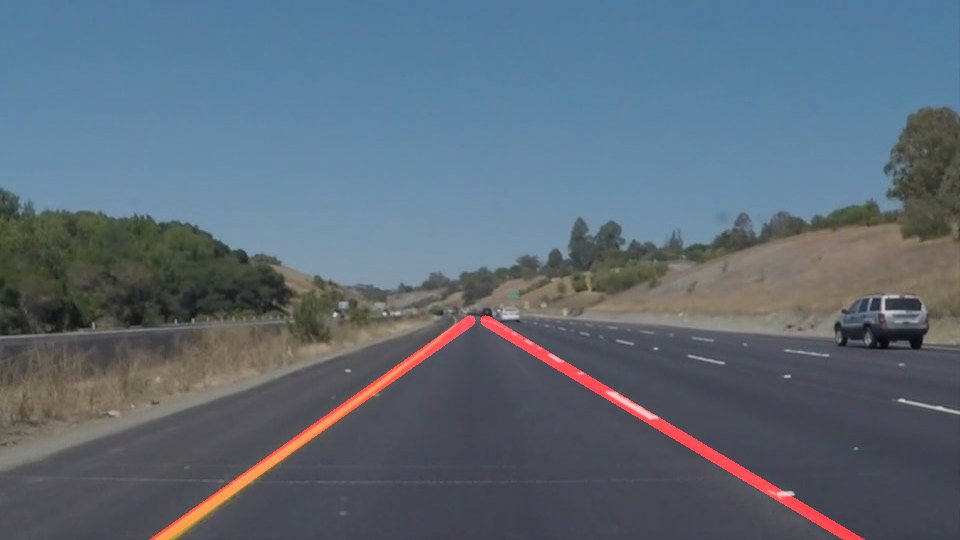
To draw a single line on the left and right lanes, I modified the draw_lines() function by separating line segments by their slope to decide which segments are part of the left line vs. the right line. During this process, I selected only those lines whose angle fell between 20 and 45 degrees, ignoring possible horizontal and vertical segments that could alter the average.
for line in lines:
  for x1, y1, x2, y2 in line:
    slope = ((y2-y1)/(x2-x1))

    # calculate angle to get rid of possible horizontal and vertical lines
    angle = np.arctan2(y2 - y1, x2 - x1) * 180. / np.pi
    if (angle > 20 and angle < 45) or (angle > -45 and angle < -20):
      intercept = y1 - slope * x1
      if slope > 0:
        left_slope.append(slope)
        left_intercept.append(intercept)
      else:
        right_slope.append(slope)
        right_intercept.append(intercept)
Then, I averaged the position of each of the lines and extrapolated to the top and bottom of the lane.
avg_left_slope = np.mean(left_slope)
avg_left_intercept = np.mean(left_intercept)

avg_right_slope = np.mean(right_slope)
avg_right_intercept = np.mean(right_intercept)

ytop = ytop
xtop_left = np.round((ytop - avg_left_intercept)/avg_left_slope).astype(int)
xtop_right = np.round((ytop - avg_right_intercept)/avg_right_slope).astype(int)

ybottom = img.shape[1]
xbottom_left = np.round((ybottom - avg_left_intercept)/avg_left_slope).astype(int)
xbottom_right = np.round((ybottom - avg_right_intercept)/avg_right_slope).astype(int)
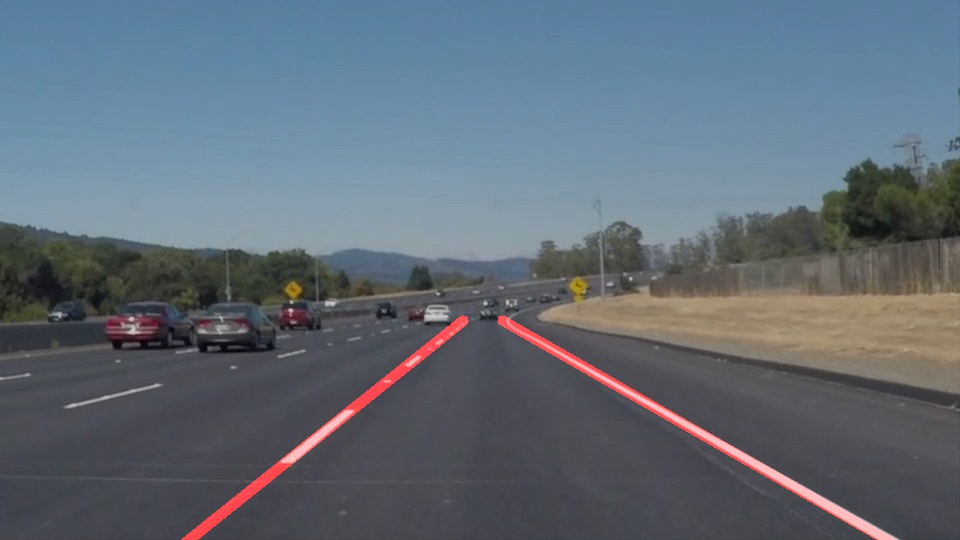
Results
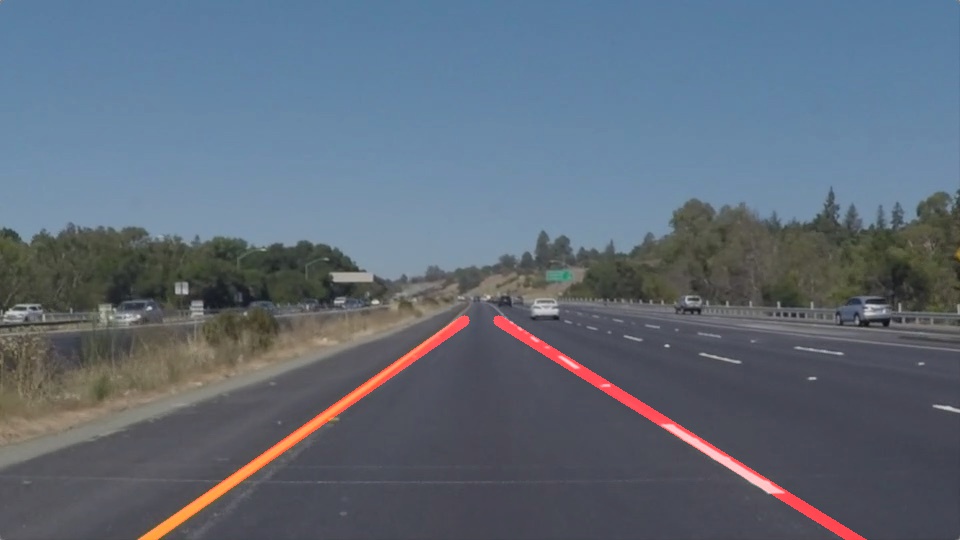
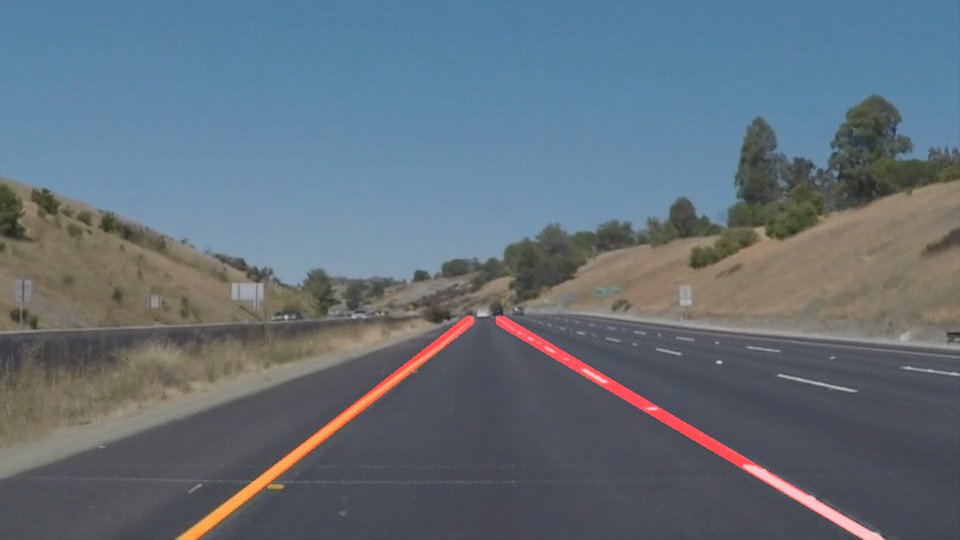
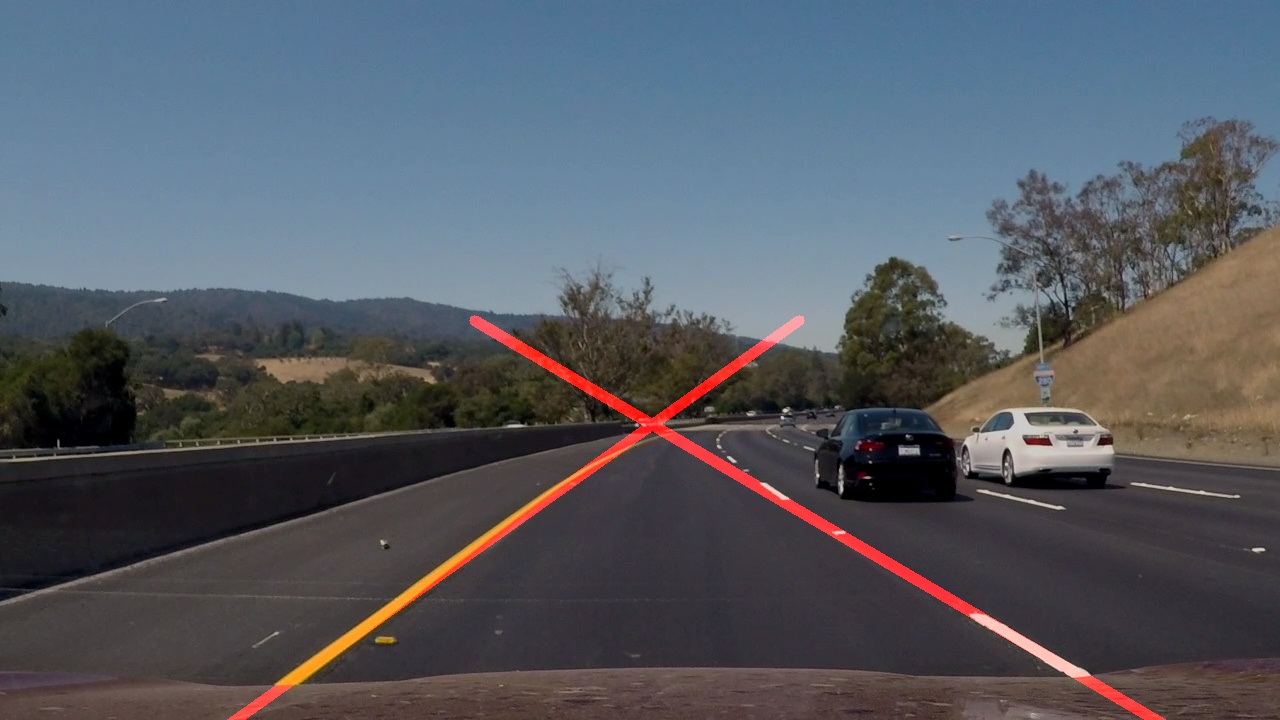
Here’s the result of the pipeline applied to all the test images included in the project:
And the final three videos:
Shortcomings with current pipeline
Potential shortcomings would occur with changing in lighting, presence of shadows and imperfections in the asphalt of the roads
Possible improvements
-
Predict the most probable area where the lines will be based on the previous frame rather than recomputing the whole pipeline for each frame.
-
Use a smoothing method to get rid of the flickering effect of the lines between one frame and another