Finding Lane Lines on the Road
The purpose of this post is to explain the theory behind the project Finding Lane Lines on the Road and build up some intuition about the process. There won’t be any snippets from the source code since we only want to build a high level understanding of why we do what we do.
Let’s always keep in mind that the goal is to identify and track the position of the lane lines in an image. So, we first ask ourselves, what useful features does a lane line have that we can use?
- Color
- Shape
- Orientation
- Position in the image
This seems like a good starting point.
One first approach could be trying to find the lane lines using only the color. Since we know they’re white, we could easily identify them in the image, right? No. Let’s first think about what color actually means in the case of digital images. It means that an image is made up of a stack of three images: one each for Red, Green and Blue (also called channels).
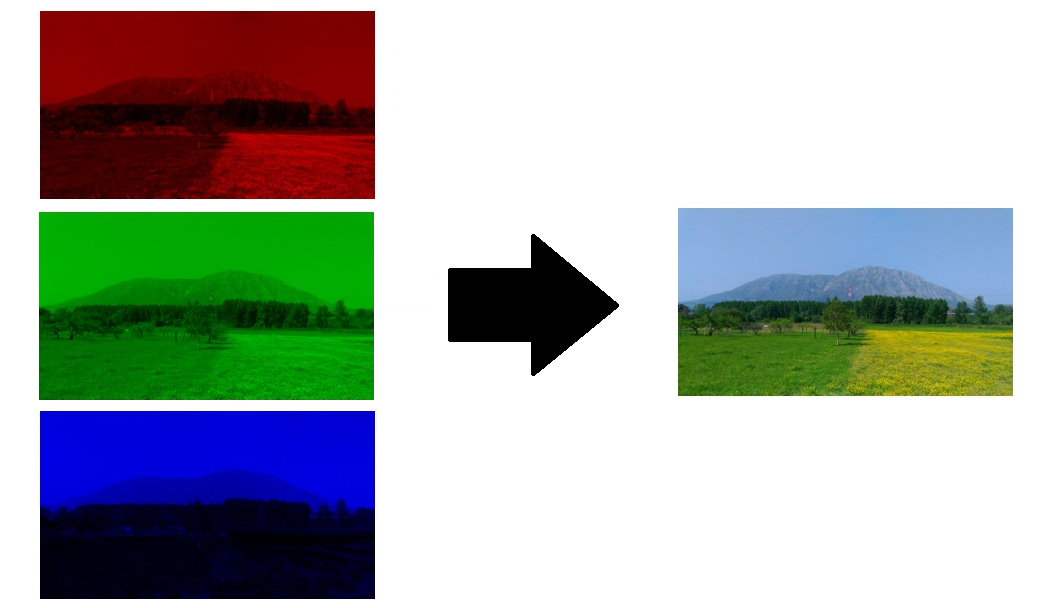
These images take values between 0 and 255. Each of these elements represents a value of intensity of a pixel. As it happens though, lane lines are not always the same color, and even lines of the same color under different lighting conditions (day, night, etc) may fail to be detected by our simple color selection. And that’s why we need more complex computer vision tools such as Canny Edge Detection.
The idea of using color selection is not wrong per se, we just have to see it as part of a bigger picture. Let’s take a step back, and start from the beginning.
Converting to grayscale
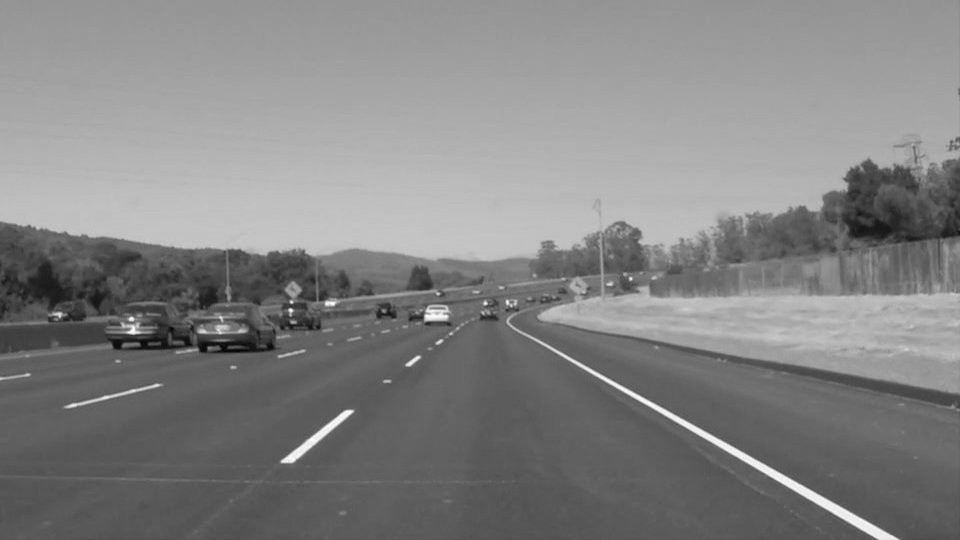
At first, we convert the image to grayscale. This way, all bright colors will be white and more easily detectable.
Gaussian Smoothing Filter
Then, we apply a Gaussian Smoothing Filter to get rid of the noise. How does it work?
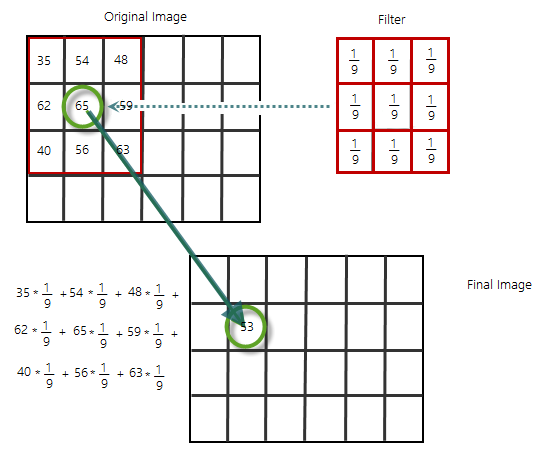
The basic idea is to smooth out the whole image by replacing every pixel value based on the value of its neighbors.
At first glance - as shown in the image above - we could replace every value with the average of all the values in its neighborhood. We have to make two assumptions for the moving average to work:
- The true value of pixels are similar to the true value of pixels nearby.
- The noise added to each pixel is done independently.
This doesn’t hold for every image.
This is also called box filtering because it looks as if we’re passing a “squared” filter all over our image. But squares aren’t smooth, and filtering an image with a filter that isn’t smooth won’t give me the blurry effect I’m looking for.
To get a sense of what’s wrong, let’s think about what a single spot of light viewed by an out of focus camera would look like:
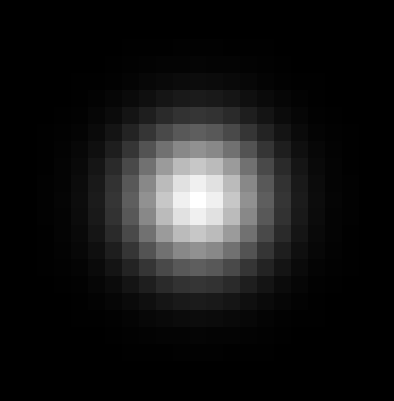
It looks like its values are higher in the middle, falling off to the edges. Something like this:
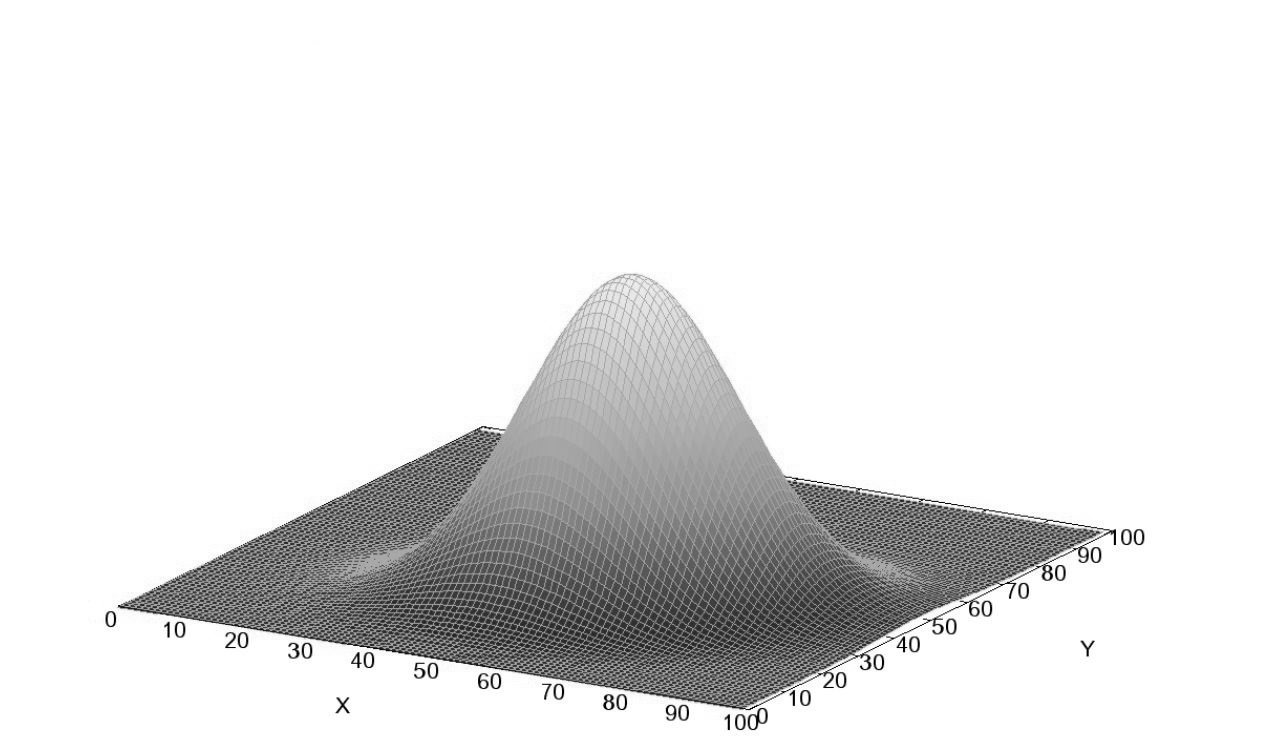
And that’s why we need a Gaussian Smoothing Filter, which looks more like this:
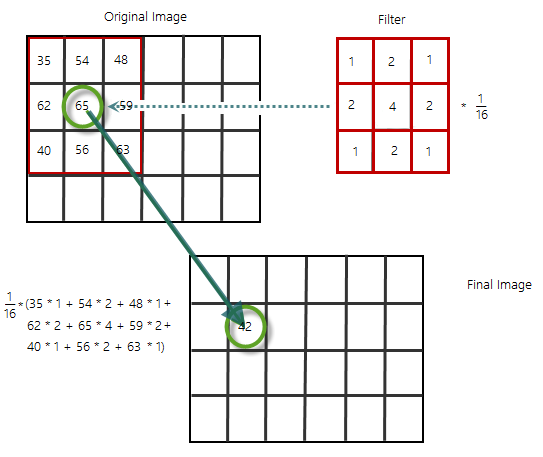
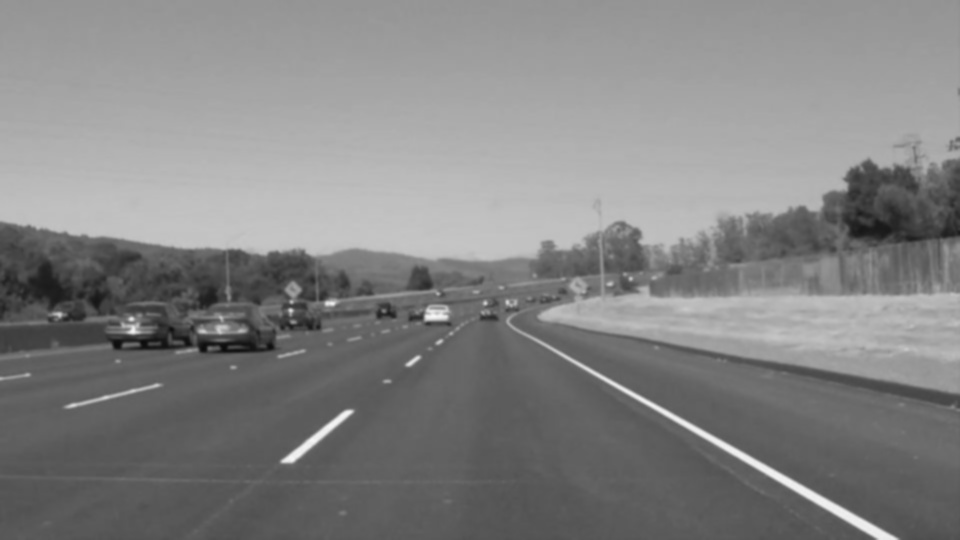
As a result, the image will appear slightly more blurry.
Color selection
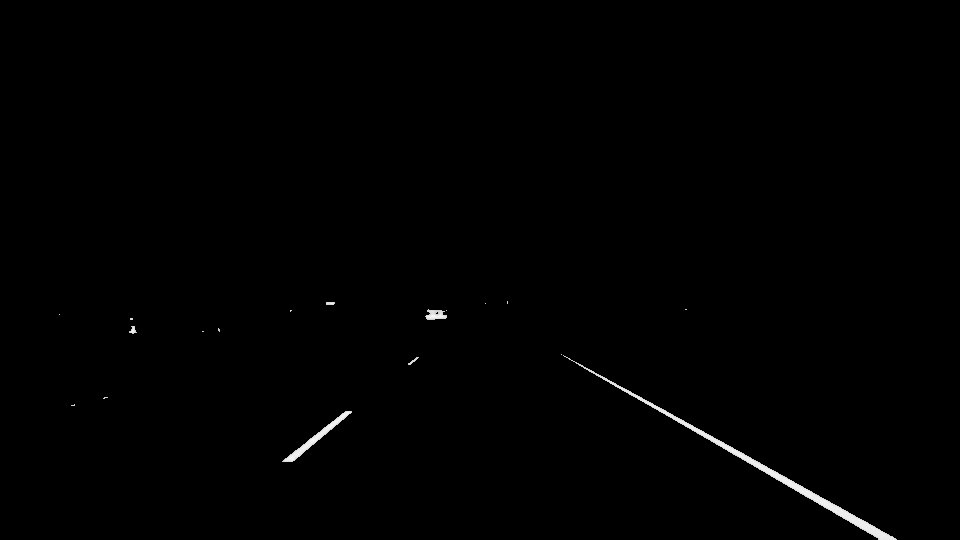
That’s when we can finally isolate the white pixels of the lanes by defining a threshold for each channel. Basically, what we want is a black image where only the white pixels survived.
Canny Edge Operator
Looking at a grayscale image I see bright points, dark points and all the gray area in between. Edges seem to occur at “change boundaries” that are related to shape or illumination.
What do I compute to figure out that a pixel is part of an edge?
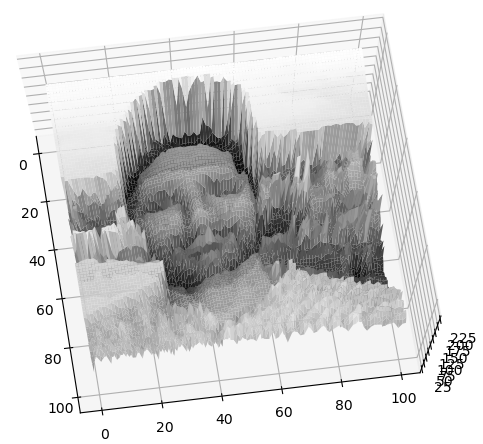
Let’s recall that an image is a function. I can look at its 3D plot where on the Z axis is the pixels value (or its intensity)

Edges look like steep cliffs, steep changes in our image intensity function.
The basic idea to identify edges is to look for a neighborhood with strong signs of change. When we look at it like that two questions come to mind:
- how big is the neighborhood?
- how do I detect the change?
When I deal with functions, change is gonna be about derivatives. An image is just a mathematical function of x and y, so I can perform mathematical operations on it like a derivative (that in this case is essentially the value difference from pixel to pixel), and since images are bidimensional, it makes sense to take the derivative with respect to x and y simultaneously. This is what’s called a gradient and by computing it I’m calculating how fast pixel values are changing at each point in an image and in which direction they’re changing most rapidly.
On the left is the gradient in the x direction and on the right in the y direction.
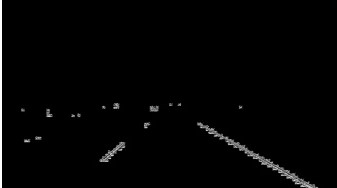
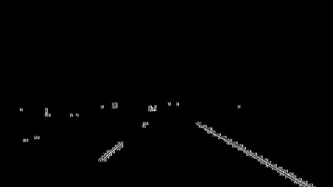
The brightness of each pixel corresponds to the magnitude of the gradient at that point. How do we calculate this gradient? We run some filters, just like we did above with the Guassian Smoothing Filter but, this time, the values in the grid will be different. The Sobel Operator is a good example to calculate both x and y derivatives.
Computing the gradient gives us thick edges, what we want to do is to thin out those edges to find just the individual pixels that follows the strongest gradient, and then tracing them all out. How do we do that?
We threshold the gradient: at first, we select a high threshold and we keep only those pixels whose value is above this level. Next, we apply something called Non-maximum suppression or thinning:
if we have a bunch of points that exceed our threshold locally - the thick lines we found above are made up of multiple points one next to the other - we only want to pull out those that exceed it the most, our peaks. If we crossed these lines transversally we wouldn’t find a flat surface because the values of the pixels vary even when moving perpendicularly to the line. We basically select the highest value for each tiny portion of the line and the result will be a much thinner line.
Unfortunately, not all pixels survive the thresholding and we might miss some lines in the image. That’s where the Canny Edge Detector goes the extra mile. We apply a low threshold to find weak but plausible edge pixels. Finally, we extend those strong edges following the weak pixels. The pixels with value between the high threshold and the low threshold are included as long as they’re connected with strong edges.
As a result, we obtain a binary image with white pixels along the edges and black everywhere else.
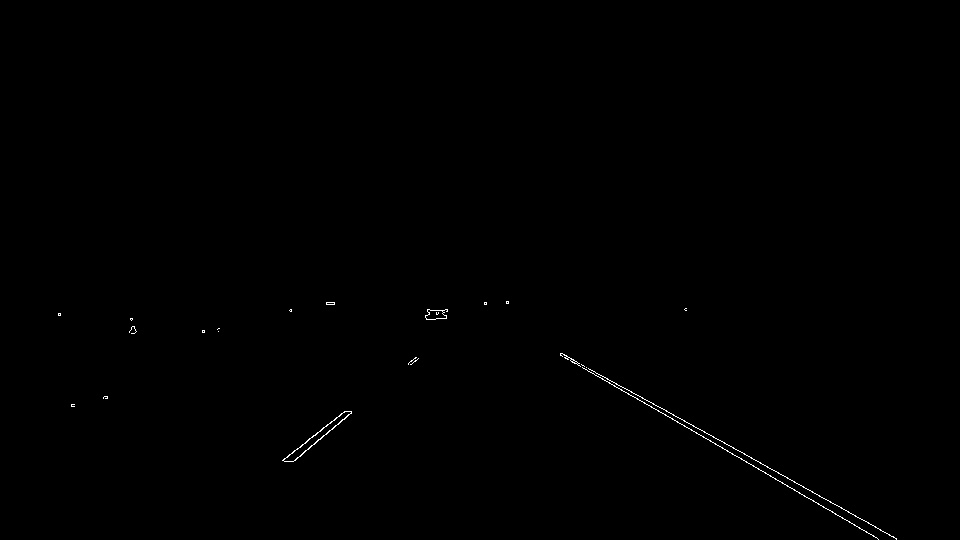
The pixels value varies between 0 and 255, hence the derivatives will be in the tens or hundreds. A reasonable low-high threshold ratio is 1:2 or 1:3.
Region Selection
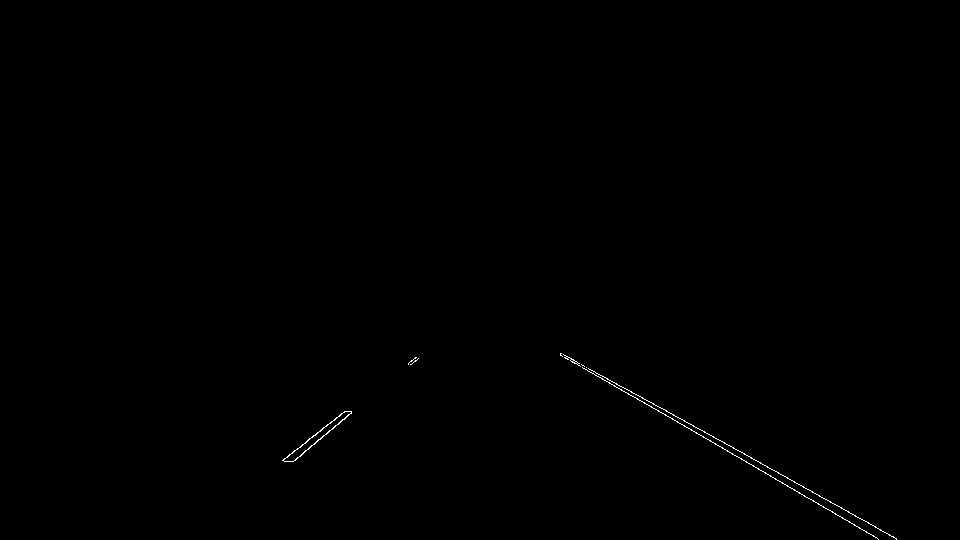
We can assume that the front facing camera that took the image is always in the same position, hence the lanes will always appear in the same area. We can take advantage of this to consider only the pixels in the region of our interest by creating and applying a mask. This way, we can get rid of possible pixels that would alter our search for lane lines.
Hough Transform
We’ve taken a grayscale image and using edge detection we turned it into an image full of dots representing edges in the original image. Let’s keep in mind that we’re looking for lines.
To find lines I need to adopt a model of a line and then fit that model to the assortment of dots in my edge detected image.
Given that an image is just a function of x and y, as my model I can use the equation of a line y = mx + b, and to find the line that passes through all the points making up a lane line I use a Hough Transform.
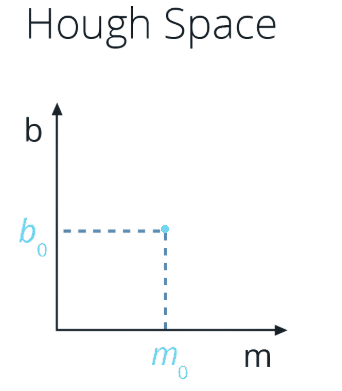
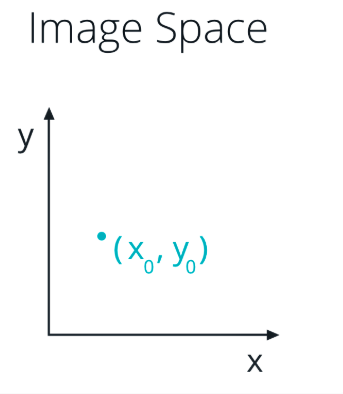
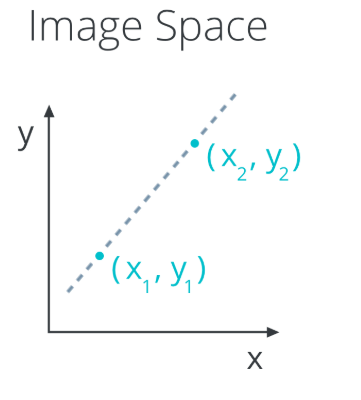
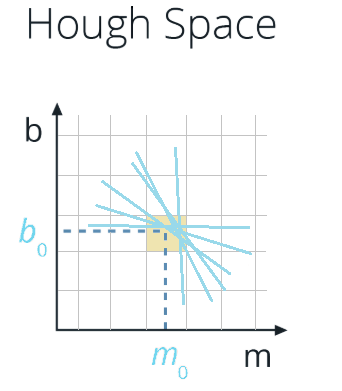
The Hough Transform is just the conversion from Image Space - where I use (x,y) coordinates - to Hough Space - where I use (m, b) coordinates. So, the characterization of a line in Image Space will be a single point at the position (m, b) in Hough space.
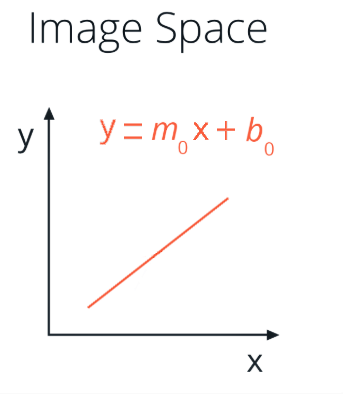
At the same time, a single point in Image Space has many possible lines that pass through it, but not just any lines, only those with particular combinations of the m and b parameters. Rearranging the equation of a line, we find that a single point (x,y) corresponds to the line b = y - xm. A single point in Image Space represents a line in Hough space.
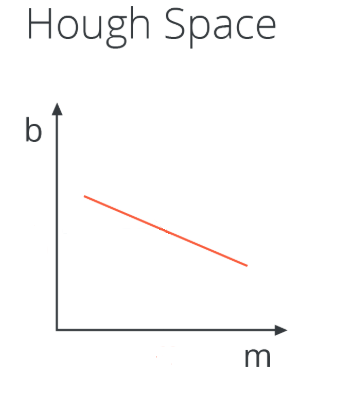
What does the intersection point of the two lines in Hough space correspond to in image space? A line in Image Space that passes through both points corresponding to the two lines.
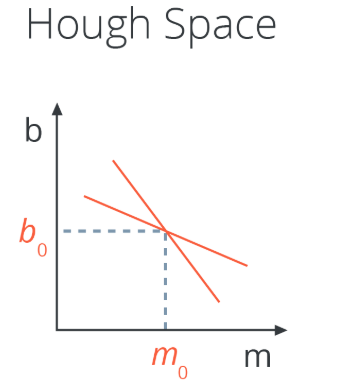
So our strategy to find lines in Image Space will be to look for many intersecting lines in Hough Space, because it means we have found a collection of points in Image Space (each line in Hough Space is a point in Image Space) that belong to the same line (in Image Space). How do we do that? By dividing the Hough Space into a grid and define intersecting lines as all lines passing through a given grid cell.
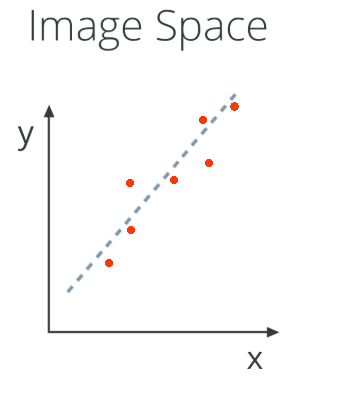
The problem raises with vertical lines because they have infinite slope in the (m,b) representation. So, we need a new parametrization: polar coordinates, where

Now each point in Image Space corresponds to a sign curve in Hough Space but the intersection of the sign curves in Hough Space still represents my line in Image Space.
One final concern would be: will this “voting system” work even if we have noise? Yes, because noise and clutter cast votes too, but their vote should be “inconstistent” with the majority of good votes.
